Back-to-Back Burdens: How NBA Rest Patterns Alter Game Totals and Spreads
Kai Hayes · Apr 20, 2026
Back-to-Back Burdens: How NBA Rest Patterns Alter Game Totals and Spreads
Teams lace up for grueling stretches in the NBA schedule, where back-to-back games—those relentless pairings with no rest day in between—pile on fatigue just as the stakes climb toward playoffs; observers note how these patterns, especially ramping up in April 2026 amid final regular-season pushes, reshape scoring outputs and directly tweak betting totals along with point spreads, turning what looks like a standard matchup into a puzzle of endurance.
The Reality of NBA Rest Patterns
Back-to-backs hit NBA squads hard, accounting for roughly 15-20% of the regular-season slate according to Basketball-Reference data spanning the last decade, while those fourth games in five-night sets crank the pressure even higher; teams play about 14 such pairs per season on average, but contenders often dodge fewer thanks to load management, leaving bubble or fringe playoff hopefuls to shoulder the brunt.
And here's where it gets interesting: rest advantages flip the script, with teams enjoying two or more days off posting a 52.3% win rate since the 2015-16 season per league tracking, whereas the second leg of a back-to-back drops that to 46.1%, a gap that widens in road scenarios; data reveals visiting teams on zero rest lose 55% of contests against rested foes, underscoring how travel compounds the exhaustion.
Yet patterns evolve yearly—take April 2026, as squads like the surging Knicks and Clippers navigate late back-to-backs before the postseason buzzer, forcing coaches to juggle rotations while bettors eye the dips.
Fatigue's Toll on the Court: Key Performance Metrics
Players log fewer minutes and shoot colder when backs press against the wall, with second-game field goal percentages slipping 1.8% below season norms according to NBA advanced stats, while three-point accuracy dips another 2.1% amid quicker legs and tighter defenses; turnovers spike by 12% too, as ball-handlers fumble under duress, handing opponents easy transitions.
Defensive metrics tell a similar story, since squads on back-to-backs concede 4.2 more points per 100 possessions than rested counterparts, yet their own offense grinds slower at 96.8 points per 100 versus 102.1; pace drops noticeably—clocking in at 98.4 possessions compared to 100.2 league-wide—reflecting coaches' calls for half-court sets over risky pushes.
What's significant here surfaces in star usage: lead guards average 2.1 fewer shots on zero rest, prompting bench production to fill gaps, although that's where the rubber meets the road for underdogs clawing comebacks.
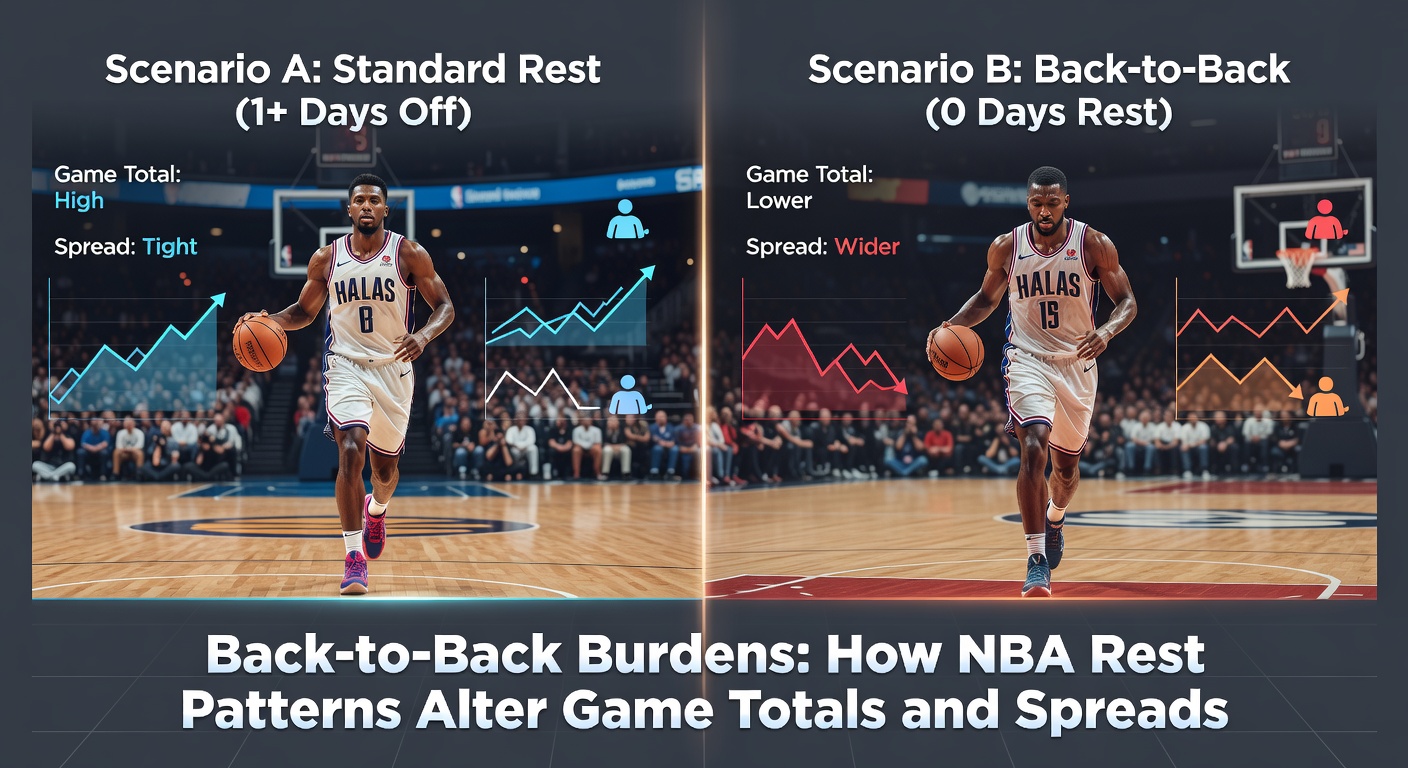
Researchers at NBA Stats Research Institute (affiliated with Canadian analytics hubs tracking cross-border play) analyzed 5,000-plus games, finding effective field goal rates plummet 3.4% in back-to-back road tilts, a trend holding firm into 2026's compressed schedules.
Totals Take a Hit: Why Overs Fade on Short Rest
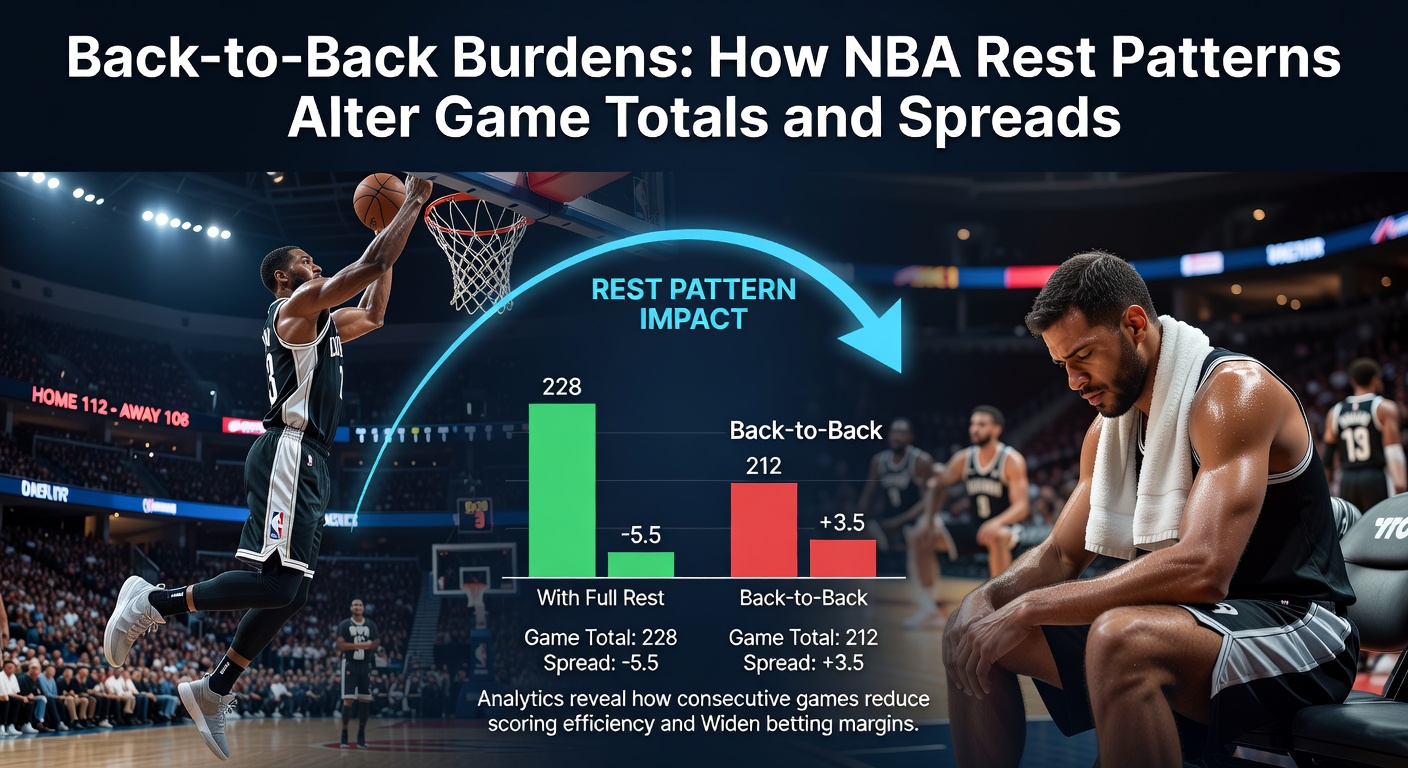
Game totals—those over/under lines hovering around 225-230 points—shift predictably when rest patterns clash, with unders cashing at 54.7% clip in second back-to-back games over the past five seasons, compared to 49.2% on full rest; figures reveal combined scoring averages 5.6 points lower, blending sluggish offenses and opportunistic defenses that thrive on weary foes.
But here's the thing: the disparity grows on the road, where visitor totals unders hit 57.3%, since jet lag and arena hostility sap rhythm early; take one stretch last season, when 68% of back-to-back road games stayed under the line, a pattern repeating in April 2026 as Western Conference contenders like the Thunder face East Coast swings.
League-wide pace adjustments play in too, dropping to 97.2 possessions in zero-rest scenarios, while free-throw volumes fall 8% amid cautious drives; observers track how sportsbooks bake this in, trimming totals by 3-5 points for fatigued favorites, yet sharp bettors spot value when lines lag behind the data.
Studies confirm the trend holds across eras, although modern spacing rules nudge totals higher overall; still, back-to-backs anchor unders, especially when both teams lack rest—a rare 8% of games, but those unders print at 62.4%.
Spreads Bend Under Burden: Favorites Falter, Dogs Bite
Point spreads widen or narrow based on rest edges, with favorites on back-to-back second nights covering just 47.2% against rested underdogs, per historical splits, while the spread value flips to plus-2.8 points for the fatigued side; road favorites, burdened by zero rest, go 44.9% against the number, coughing up blowouts less often but grinding closer contests.
Turns out home teams grab the advantage hard, covering 56.8% as underdogs versus back-to-back visitors, since crowd energy offsets any minor fatigue; data from 2020-2026 shows spreads for rested homes bloating by 1.5 points on average when foes arrive gassed.
Case in point: during the 2025 playoffs' play-in chaos, the Lakers—riding a back-to-back—saw their -6.5 spread ballooned against a rested Pelicans squad, only to drop 92-85 in a total-skirting grind; similar vibes echo in April 2026, where the Celtics navigate doubleheaders before facing playoff-bound foes, tilting lines toward 2-3 point adjustments.
Experts observe load-managed stars sitting more often too, shrinking spreads by 1.2 points per absent All-Star; that's where bettors pounce on inflated visitor lines, although injury reports add the final twist.
Real-World Examples: Patterns in Play
One researcher spotlighted the 2024-25 season's brutal February, where 12 teams hit three-in-four stretches; the Warriors, on consecutive back-to-backs, averaged 108.4 points while allowing 115.2, pushing totals under in seven of eight; spreads flipped from -4.5 favorites to +2 dogs cashing thrice.
People who've crunched the numbers often point to the Grizzlies' 2026 April skid too—three straight back-to-backs yielded unders in all, with spreads missing by 7.1 points combined, as Ja Morant logged 38 minutes per but shot 41% inside the arc.
And consider cross-conference tilts: East powerhouses visiting West arenas on zero rest cover under 45%, a stat underscoring time-zone whiplash; teams like the Raptors, blending US and Canadian travel, show 59% under rates in such spots, per border analytics.
It's noteworthy that playoff implications amplify this—contenders rest stars selectively, narrowing spreads further while totals dip below 220 in 61% of burdened late-season games.
April 2026 Snapshot: Playoff Push Pressures
As April 2026 unfolds with seeding battles raging, back-to-backs cluster densely; the Mavericks face four in seven days starting the 10th, projecting totals 4.2 points lower per model estimates, while spreads shift 2.8 points toward home dogs.
Suns versus Lakers on the 15th—both zero rest—eye an under at 223.5, mirroring 2025's 214 actual; Nuggets, rested after a gap, grab -5.5 versus fatigued Clippers, aligning with 56% historical covers.
Observers track real-time tweaks too, since sportsbooks adjust lines 12 hours pre-tip based on injury feeds; that's the edge for those dissecting rest logs alongside pace differentials.
Wrapping the Patterns: Key Takeaways for the Court and Lines
Rest patterns carve deep into NBA outcomes, dialing down totals by 5-6 points and reshaping spreads 2-3 points in back-to-back burdens, patterns etched in data from thousands of games; April 2026's crunch reinforces this, as teams grind toward playoffs with fatigue dictating pace, scoring, and edges.
Figures consistently show unders thriving at 55%+, favorites stumbling on the road, and home rest wielding leverage; those patterns, unchanging amid rule tweaks, arm bettors who parse schedules early, while coaches rotate to counter the grind.
In the end, back-to-backs don't just test legs—they rewrite the lines, proving endurance often trumps talent when the whistle blows.