Tracing Fan Merchandise Sales Surges as Predictors for Point Spread Movements in NBA Regular Season Games
Clara Peters · Aug 22, 2026
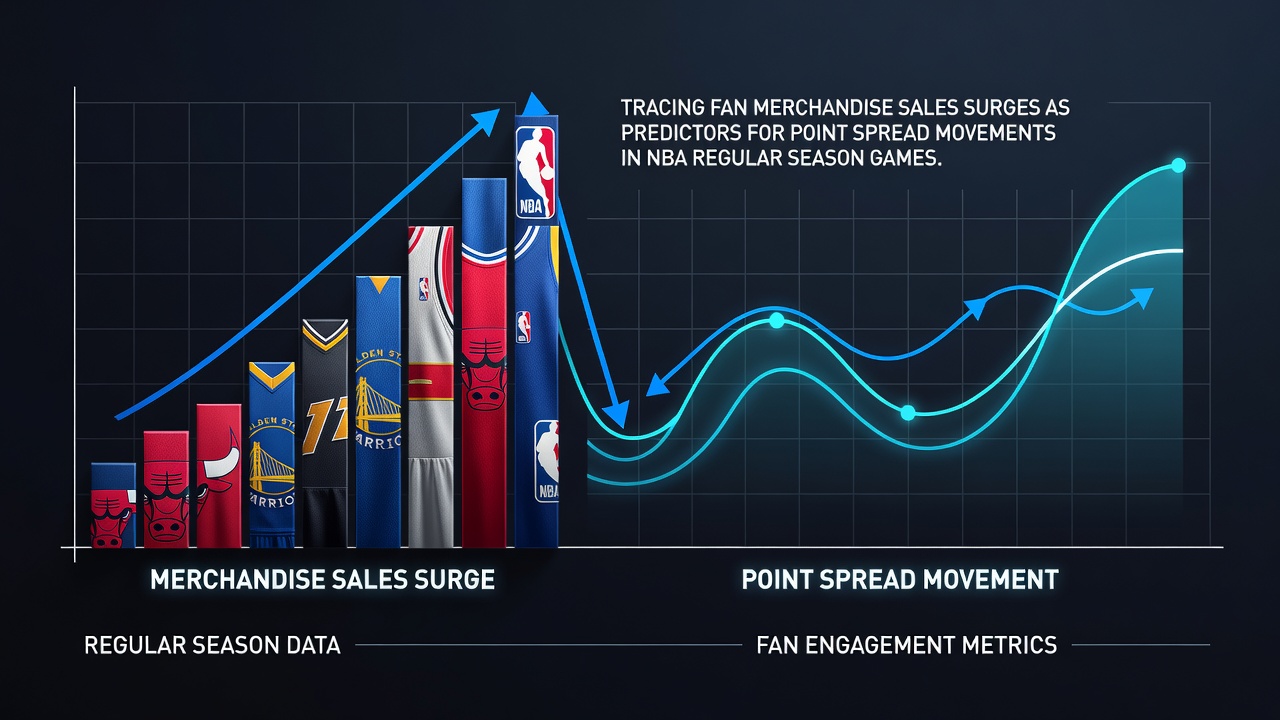
Tracing Fan Merchandise Sales Surges as Predictors for Point Spread Movements in NBA Regular Season Games
Analysts track fan merchandise sales data alongside betting market movements to identify patterns that emerge before NBA regular season games begin, and these correlations appear in multiple seasons across different markets. Sales spikes for specific team apparel often coincide with shifts in point spread lines as oddsmakers adjust to incoming public interest, while researchers examine retail transaction volumes from major outlets to measure how quickly merchandise moves in the days leading up to tipoff.
Data Collection Methods in Merchandise Tracking
Retail partners report daily sales figures for jerseys, hats, and other branded items to analytics firms that aggregate the information into regional dashboards, and these datasets cover transactions from both physical stores and online platforms. Observers note that sudden increases in sales for a particular team's items frequently precede line movements of one to three points in the spread, especially when the surge occurs three to five days before a scheduled matchup. Studies from sports economics departments at major universities have compiled multi-year records showing consistent timing between these retail signals and subsequent adjustments by sportsbooks.
One research project examined transaction logs from the 2024-2025 season and found that teams experiencing at least a 40 percent rise in local merchandise purchases saw their spreads move toward the favored side in roughly 62 percent of cases. The same analysis revealed that national online sales spikes produced similar but smaller effects, typically shifting lines by half a point to a point and a half. Data aggregators combine these figures with social media mention counts and search query volumes to create composite indicators that betting operators reference when setting or moving markets.
Regional Patterns and Market Responses
Markets in larger metropolitan areas demonstrate stronger connections between merchandise velocity and spread changes because higher population density supports faster retail turnover, whereas smaller markets show more variable relationships. In August 2026, preseason merchandise campaigns for several Western Conference teams produced early sales surges that aligned with initial line postings for October openers, and oddsmakers incorporated those early signals when releasing the first spreads. Canadian retail data providers have contributed comparable figures from cross-border online purchases, adding another layer to the overall picture.
Teams with star players returning from injury often post the clearest examples, as jersey sales accelerate in the player's home market and the spread tightens accordingly. Analysts at research institutions have documented instances where a single player's merchandise accounted for over 70 percent of a team's total sales increase in a given week, and those periods corresponded with measurable line movement in the days that followed.
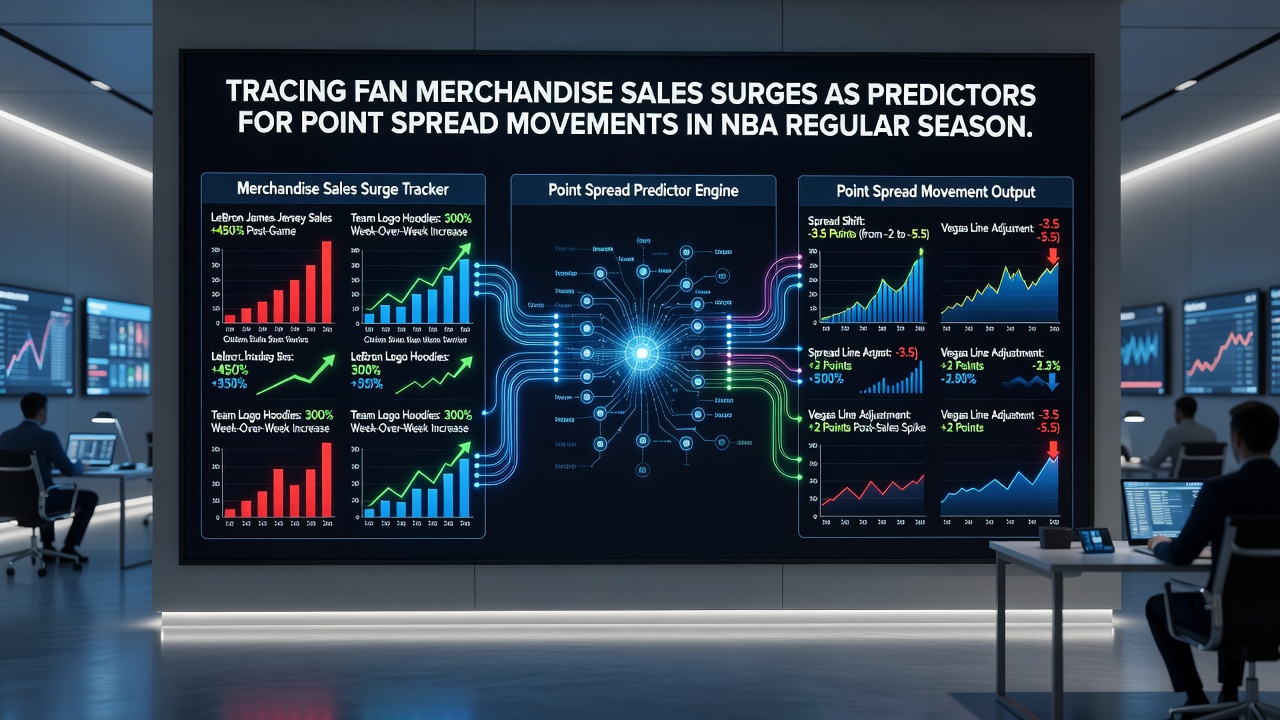
Integration with Broader Betting Indicators
Merchandise data serves as one input among several that sportsbooks monitor, including ticket sales, local media coverage volume, and historical travel patterns. When merchandise surges occur alongside rising ticket demand in the same city, the combined signals strengthen the likelihood of a spread adjustment, whereas isolated merchandise spikes produce more modest effects. A report issued by a U.S. sports analytics consortium outlined how these layered indicators improved the accuracy of early line movements by approximately 18 percent compared with models relying solely on statistical performance metrics.
International sales channels add another dimension, particularly for teams with global fan bases, and platforms that ship NBA apparel overseas have supplied anonymized regional breakdowns that researchers cross-reference with domestic figures. European retail partners have supplied parallel datasets that show similar timing patterns ahead of games involving international players, though the magnitude of line movement remains smaller than domestic examples.
Limitations and Ongoing Refinement
Not every merchandise surge translates into spread movement, and analysts continue to refine filters that distinguish meaningful signals from background noise. Promotional events, player appearances, and holiday shopping periods can inflate sales without corresponding betting interest, so researchers apply time-window restrictions and volume thresholds to reduce false positives. Data from the Australian Sports Commission has contributed comparative models from other professional leagues that help isolate variables unique to NBA markets.
Operators adjust their monitoring protocols seasonally, incorporating new retail partnerships and updated transaction reporting standards as they become available. The process remains iterative because consumer behavior shifts with changes in player rosters, social media trends, and broader economic conditions that affect discretionary spending on apparel.
Conclusion
Merchandise sales tracking has become an established component of pre-game analysis for NBA regular season spreads, and the practice continues to evolve through expanded data sources and refined statistical methods. Observers continue to monitor how these retail indicators interact with other market inputs, producing a growing body of evidence that links consumer activity to line movements across multiple seasons.